Maryland casinos generate $163.2 million in gaming revenue during April
BALTIMORE, MD—Maryland’s six casinos combined to generate $163,150,675 in revenue from slot machines and table games during April 2024, a decrease of $11,591,543 (-6.6%) compared to April 2023.
Casino gaming contributions to the state during April 2024 totaled $69,799,072, a decrease of $2,577,110 (-3.6%) compared to April 2023.
Contributions to the Education Trust Fund during April 2024 were $50,357,002, a decrease of $2,267,916 (-4.3%) compared to April 2023. Casino gaming revenues also support the communities and jurisdictions where the casinos are located, Maryland’s horse racing industry, and small, minority- and women-owned businesses.
Maryland’s six privately owned casinos offer both slot machines and table games: MGM National Harbor in Prince George’s County; Live! Casino & Hotel in Anne Arundel County; Horseshoe Casino Baltimore in Baltimore City; Ocean Downs Casino in Worcester County; Hollywood Casino Perryville in Cecil County; and Rocky Gap Casino Resort in Allegany County.
The gaming revenue totals for April 2024 are as follows:
- MGM National Harbor (2,275 slot machines, 207 table games)
$68,086,205 in April 2024, a decrease of $7,410,780 (-9.8%) from April 2023 - Live! Casino & Hotel (3,857 slot machines, 179 table games)
$60,867,431 in April 2024, a decrease of $1,147,522 (-1.9%) from April 2023 - Horseshoe Casino (1,340 slot machines, 115 table games)
$14,674,517 in April 2024, a decrease of $1,770,269 (-10.8%) from April 2023 - Hollywood Casino (711 slot machines, 23 table games)
$7,930,067 in April 2024, an increase of $448,187 (6.0%) from April 2023 - Ocean Downs Casino (857 slot machines, 19 table games)
$7,320,586 in April 2024, a decrease of $606,103 (-7.6%) from April 2023 - Rocky Gap Casino (627 slot machines, 16 table games)
$4,271,869 in April 2024, a decrease of $1,105,056 (-20.6%) from April 2023
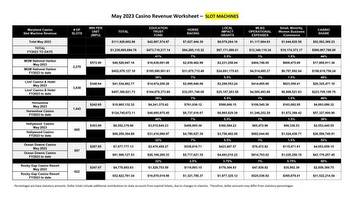
Details on each casino’s gaming revenues and contributions to the State of Maryland are included in the attached charts, and both fiscal and calendar year-to-date totals are available online here (PDF).


